Last month we looked at how to focus improvement effort on the few causes behind most of your downtime, using a Pareto view to separate the vital few from the useful many. If you missed it, the May article on top losses and Pareto thinking is the step this one builds on. But there is a problem with the Pareto you built in May. It only shows you the losses you actually captured; And in most plants, one of the most significant losses is the one nobody is recording at all. This month is about that hidden layer: microstops and small stops. The brief, frequent interruptions that never make it into a shift report, never appear on a Pareto chart, and quietly absorb a double-digit percentage of your capacity.
Why This Is the Next Step
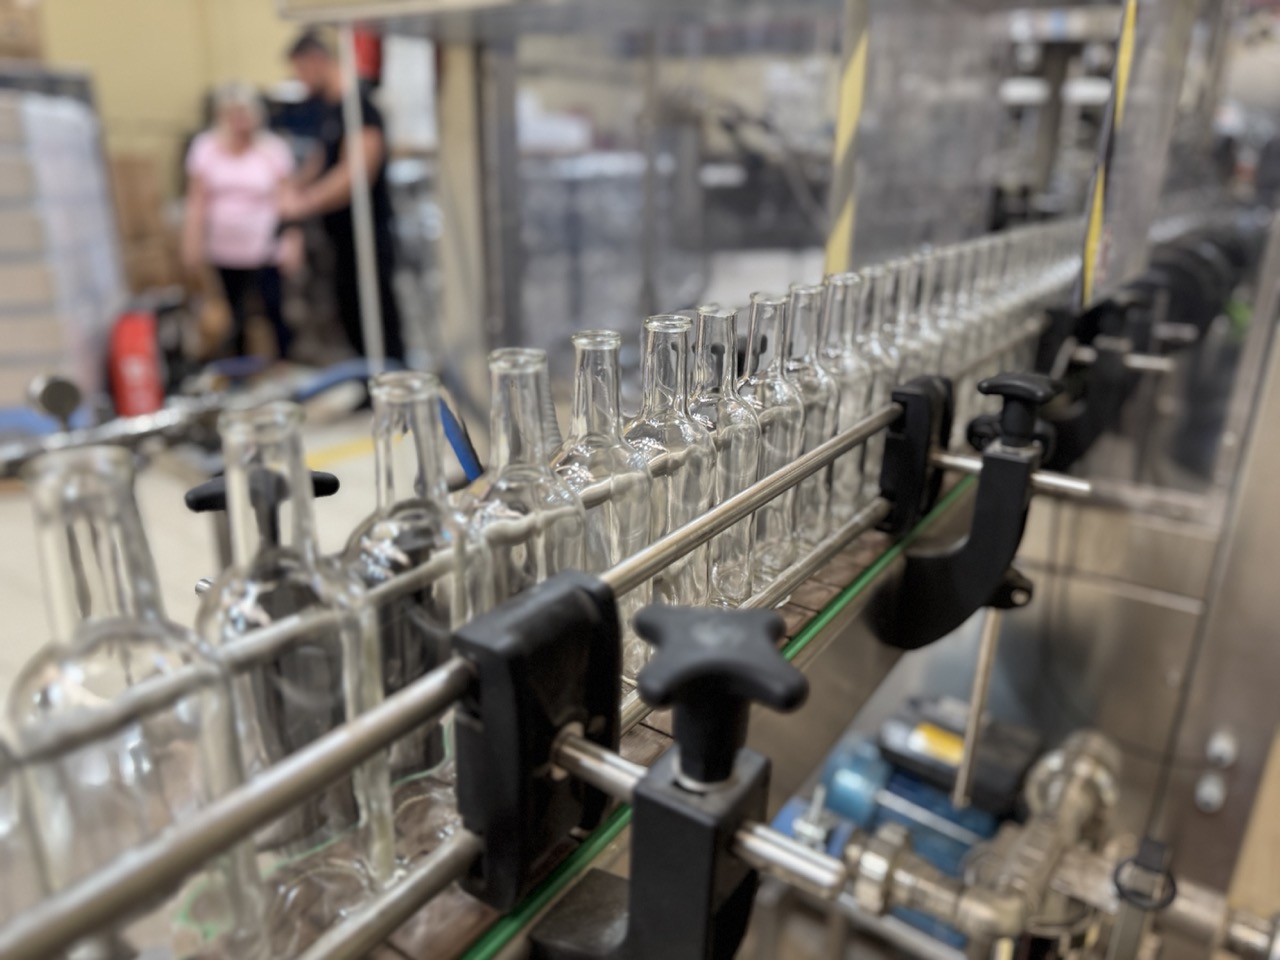
There is a reason microstops come after the Pareto work, not before. A Pareto chart is only as honest as the data feeding it. In April we cleaned the categories. In May we ranked them. But both steps depend on the loss being recorded in the first place. Microstops break that assumption, because by their nature they are not recorded.Small stops are one of the formal Six Big Losses defined in Total Productive Maintenance. In the OEE framework they sit under Performance loss, not Availability which is part of why they hide so well. They do not stop the line for long enough to trigger a downtime event in most manual systems. The line pauses, an operator clears a jam or resets a sensor, and production resumes before anyone writes anything down. Individually, none of these events feels significant. A few seconds here, half a minute there. But a line that experiences a short stop every few minutes across a shift can lose more cumulative time than a single dramatic breakdown,and unlike the breakdown, nobody ever talks about it.
What Typically Goes Wrong
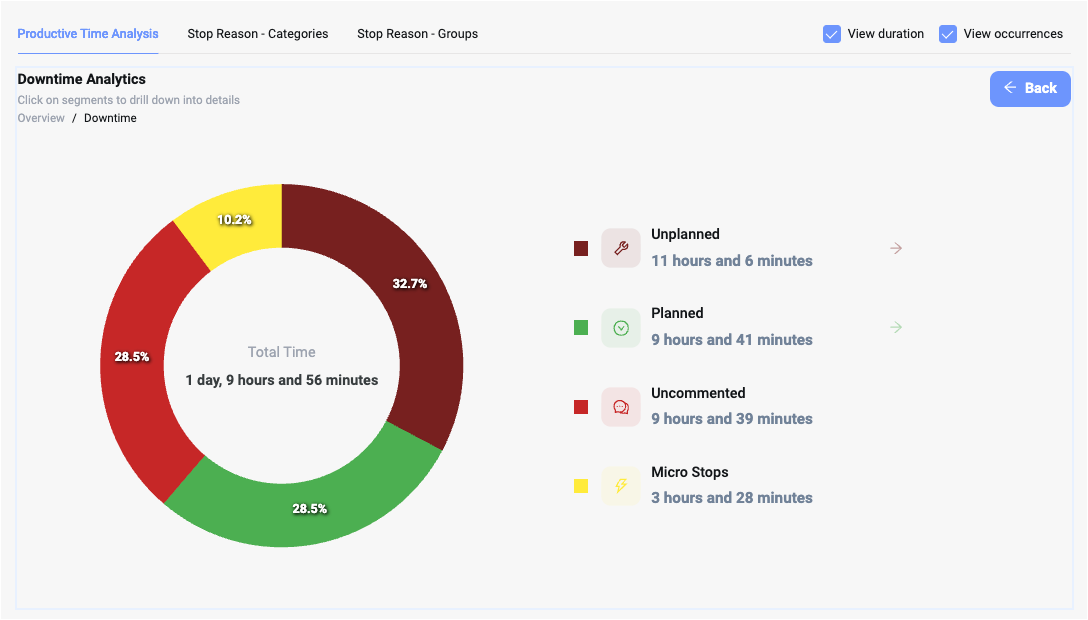
The core problem with microstops is not that plants ignore them. It is that plants genuinely cannot see them. Manual downtime tracking has a practical floor. An operator can log a 40-minute breakdown because there is time to log it and the event is clearly worth recording. The same operator cannot realistically log 150 stoppages of 10 to 30 seconds each while also running the line. Even with the best intentions, sub-minute events are invisible to manual systems. As one widely used reference on OEE puts it, these stoppages often happen on a timescale of seconds and are not even noticed by the operator. This creates three recurring failure patterns. The first is the availability illusion. A line reports 90% availability because its recorded downtime is low. But the recorded downtime only includes the events long enough to capture. The real figure, once micro-events are counted, is often several points lower.The second is misattributed performance loss. When a line runs slower than its theoretical rate but shows little recorded downtime, plants often conclude the equipment is simply running below speed. In reality, much of that gap is hundreds of tiny stops that never registered as downtime — they registered as the line just being slow.The third is chronic acceptance. Because micro-stops have always been there and have never been measured, they become part of the normal rhythm of the line. Operators stop seeing them as losses at all. They become the background noise of production.
What Good Looks Like
A plant that has its microstops under control shares three characteristics. Every stop is captured automatically, regardless of duration. There is no manual threshold below which an event disappears. A two-second stop and a two-hour stop are both recorded, time-stamped, and attributed. Short stops are analyzed by pattern, not by individual event. Nobody investigates a single ten-second stop. But two hundred ten-second stops clustered on one machine, one shift, or one product changeover point to a specific, fixable root cause. The value is in the aggregation. The line's true performance loss is separated into its real components. Once micro-stops are measured, the plant can finally distinguish between genuine speed loss and accumulated short stops - and these have completely different countermeasures.
From Data to Action
The practical sequence for getting microstops under control follows naturally from the Pareto work in May.
First, establish whether you have a microstop problem at all. If your recorded downtime is low but your OEE is still well below where it should be, the gap is almost always hiding in short stops and speed loss. That gap is your signal.
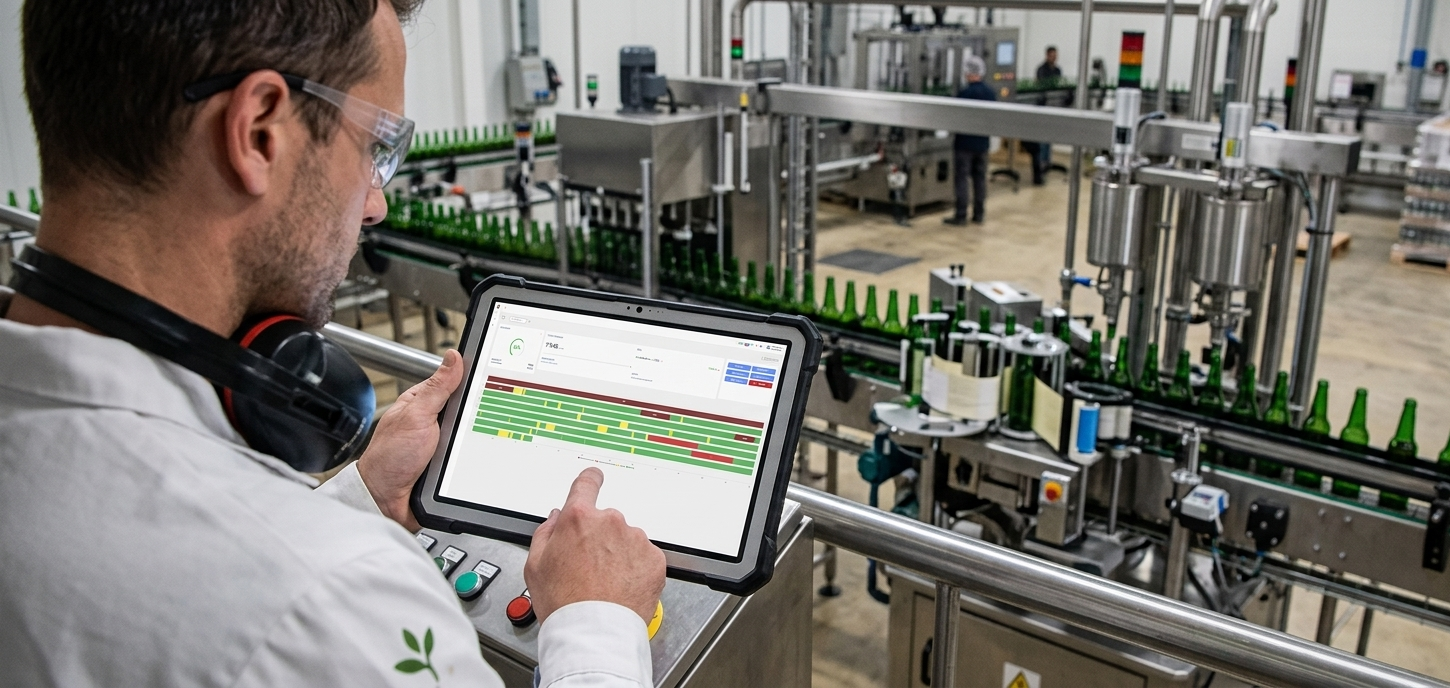
Second, capture every stop automatically for a representative period, at least a few weeks across all shifts and products. This is the step that is effectively impossible by hand and straightforward with automatic data capture.
Third, build a Pareto specifically of short-duration stops, segmented by machine, by station, by product, and by shift. The pattern that emerges is usually concentrated: a single feeder, a single sensor, a single transfer point generating the majority of the events.Fourth, treat the dominant cluster as a focused improvement target, exactly as you would treat a top loss from May's Pareto. The difference is that now you are working on a loss you previously could not even see.
Where Indeex Fits

This is precisely the loss category that separates automatic data capture from manual tracking. Indeex records every stop on the line directly from the equipment, with no duration threshold and no operator entry. A stop of a few seconds is captured with the same precision as a major breakdown. Because the capture is automatic and continuous, the micro-events that manual systems miss are simply there in the data from the start.
From that complete record, Indeex separates the line's performance loss into its real components - genuine speed loss versus accumulated short stops - and surfaces the clusters: which machine, which station, which product, which shift is generating the small stops. The plant team does not need to suspect a microstop problem and go looking for it. The pattern is visible the moment the data exists.The result is that a loss which was previously invisible becomes a concrete, prioritized improvement target - with the same clarity as any other loss on the line.
What You Can Expect
Plants that surface their microstops for the first time usually go through two reactions. The first is surprise at the scale. The hidden loss is almost always larger than the team expected, frequently in the range of 5 to 15% of OEE that nobody had accounted for. This is uncomfortable, but it is also the most recoverable capacity on the line, because micro-stops tend to have concentrated, mechanical root causes rather than diffuse ones. The second is the speed of the fix. Once the dominant cluster is identified - a misaligned guide rail, a hypersensitive sensor, a recurring jam at one transfer point - the countermeasure is often quick and inexpensive. The hard part was never the fix. It was seeing the problem in the first place.
Closing
The losses that hurt a plant most are not always the dramatic ones. Often they are the small, constant, invisible ones that no manual system was ever capable of capturing.April made the data trustworthy. May used it to focus on the biggest visible losses. June is about the layer underneath - the losses that only become visible when every stop is captured automatically. Next month, in July, we move from individual losses to the bigger question of consistency: why two shifts running the same line with the same equipment can produce very different results, and what line stability really means.
Next Step
If your recorded downtime looks low but your OEE still is not where it should be, the gap is almost certainly hiding in stops too short to track by hand.We can show you what a real production line is actually losing below the radar — every stop captured, clustered, and turned into a focused improvement target, without adding any work to the plant team.
References
1. Vorne, The Six Big Losses — vorne.com
2. Tang et al., Uncovering hidden capacity in overall equipment effectiveness management, ScienceDirect
