Last month we looked at the losses that hide below the radar — the microstops and small stops that no manual system captures, and how surfacing them recovers capacity nobody had accounted for. If you missed it, the June article on microstops is the step this one builds on.
We are now halfway through the series, and this is where the conversation changes. The first three months were all about losses - classifying them, ranking them, surfacing the hidden ones. This month is about something different: consistency. Not how much you lose, but how much your line varies from shift to shift, day to day, run to run.

Why This Is the Next Step
Once a plant has cleaned up its obvious losses (April and May) and surfaced its hidden ones (June), the performance that remains on the table is usually not a single large loss. It is variation.
Variation is the gap between your good shifts and your bad ones. It is the reason a line can hit 92% on Tuesday morning and 55% on Thursday night with no obvious explanation. And it is almost always invisible in a monthly average, because averaging is precisely the operation that erases it.
This matters for a practical reason that goes beyond tidiness. A stable line is a predictable line. You can schedule against it, promise delivery dates against it, and improve it methodically. An unstable line cannot be planned around, cannot be reliably improved, and quietly forces you to hold extra inventory, extra buffer time, and extra capacity just to absorb its swings. The instability has a cost even when the average looks acceptable.
There is also a mathematical reason instability hurts more than people expect. OEE is the product of three factors - availability, performance, and quality - multiplied together. One weak factor drags the whole score down disproportionately. A line that is inconsistent in even one dimension pays a compounding penalty, which is why, as one lean reference bluntly puts it, OEE punishes inconsistency.
What Typically Goes Wrong
The central problem is that most plants manage to an average, and the average is the one number that cannot show them a stability problem.
A monthly OEE of 75% tells you nothing about whether that came from a steady line or a wildly swinging one. Two plants with identical monthly numbers can have completely different realities: one is calm and predictable, the other is a rollercoaster that happens to average out. The team looking only at the monthly figure sees the same 75% and assumes the same situation. This leads to three recurring patterns.
The first is chasing the peak. A line hits 92% on its best shift, and that number becomes the benchmark everyone is measured against. But the best shift is not the opportunity - the gap between the best and the typical shift is the opportunity. Chasing the peak sets an unrealistic target and ignores the real problem, which is why the other shifts cannot match it.
The second is misreading a bad shift as bad luck. When a single shift underperforms, it is easy to write it off as a one-time event - a difficult product, a new operator, a material problem. Sometimes that is true. But when the variation is chronic, each bad shift is not bad luck. It is a pattern the average is hiding.
The third is improving the wrong thing. A team that does not see its variation will invest in raising the ceiling - squeezing a bit more from the already-good shifts - when the real gain is in raising the floor, bringing the worst shifts up toward the typical one. Raising the floor is almost always the larger and more achievable win.
What Good Looks Like
A plant that has line stability under control shares three characteristics.
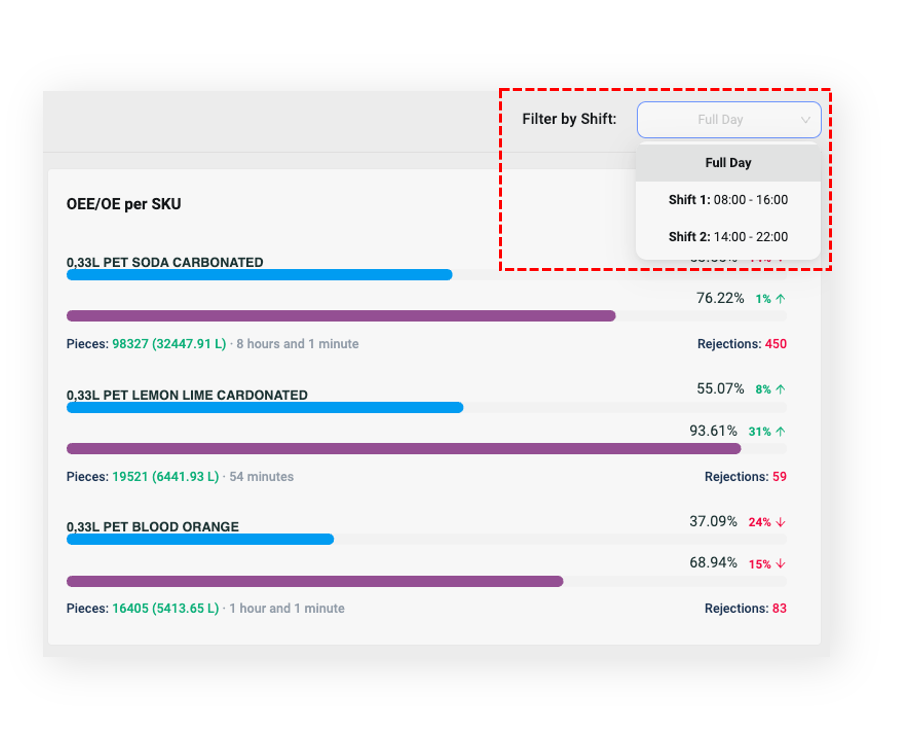
Performance is measured as a distribution, not a single number. The team looks at the spread of OEE across shifts and runs, not just the average. They know their best, their worst, and how wide the band between them is - because that band is the target.
Variation is analyzed by its natural groupings. Stability problems are rarely random. They cluster by shift, by operator team, by product, by day of the week, by season. A plant with good visibility can see that the night shift runs consistently below the day shift, or that one specific product always destabilizes the line, and can act on the specific cause.
The improvement goal is a narrower band, not just a higher average. Success is defined as the worst shifts moving up toward the best - a tighter, more predictable distribution — rather than simply nudging the average upward while the swings remain.
From Data to Action
The practical sequence for improving line stability builds directly on the loss work from the previous months.
First, stop looking only at the average. Look at the spread. Pull OEE by individual shift or run over a representative period and look at the range, not just the mean. If the band between your best and worst is wide, you have a stability problem worth pursuing - regardless of what the average says.
Second, segment the variation. Group the data by shift, by product, by operator team, by day. The goal is to find where the instability concentrates. Almost always it is not evenly spread - it lives in specific, identifiable places.
Third, focus on raising the floor. Take the worst-performing segment and treat it as the improvement target. Understand what the best shifts do differently, and work to close the gap. This is where the next two months of the series come in - standard work in August, changeovers in September - which are the practical tools for making the good shifts repeatable.
Fourth, track the band, not just the mean. Measure success by whether the distribution is tightening. A line whose worst shift keeps improving is a line becoming more predictable, even if the headline average moves slowly.
Where Indeex Fits
Line stability is invisible to anyone looking at a monthly report, and it becomes visible the moment performance is measured continuously and broken down by its natural groupings.
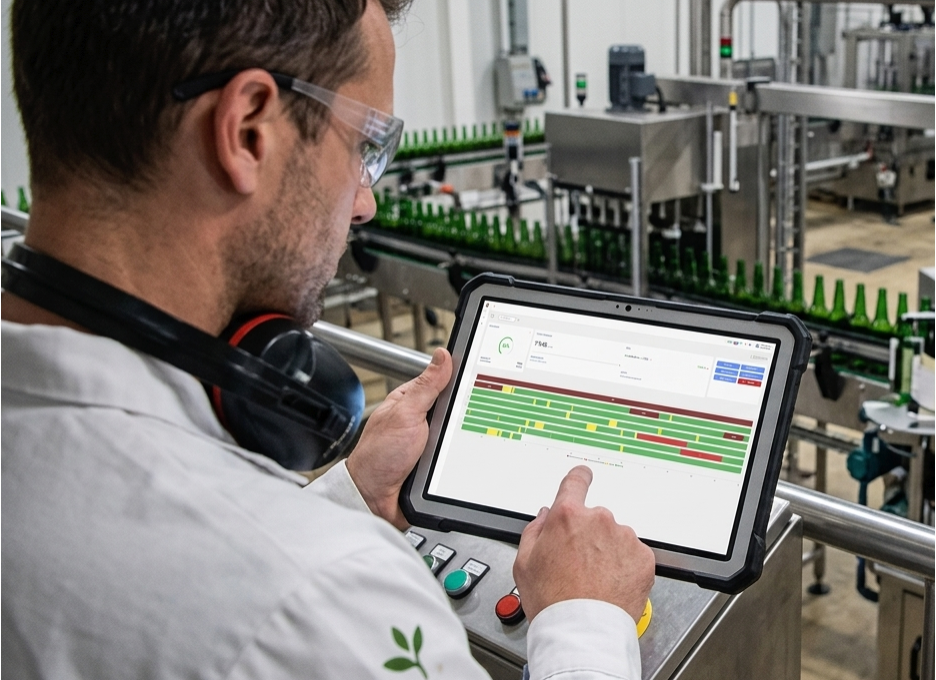
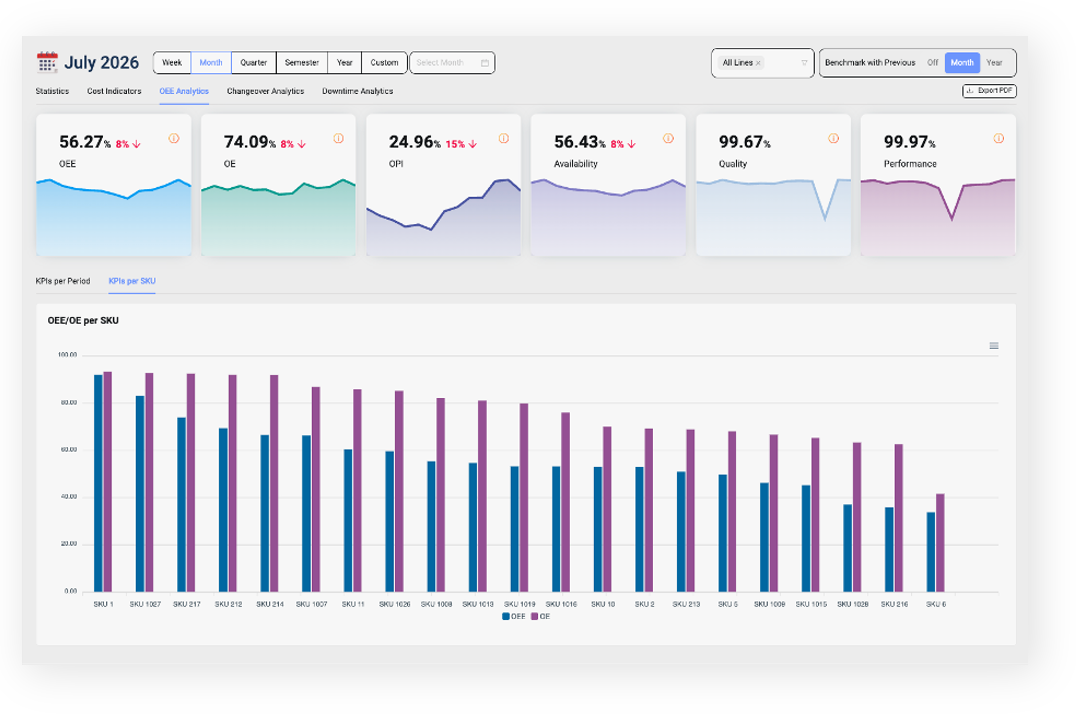
Indeex captures performance for every shift, every run, and every product automatically, and presents it as a distribution rather than a single rolled-up number. The team can see the full spread - the best shift, the worst shift, and the width of the band between them - instead of a monthly average that hides all of it.
Because the data is segmented automatically, the patterns surface on their own: the night shift that runs consistently below the day shift, the product that always widens the variation, the day of the week that reliably underperforms. The plant does not need to suspect where the instability lives and go hunting for it. The groupings are already there in the data.
The result is that a stability problem which a monthly average would completely conceal becomes a concrete, located, improvable target - with the worst shifts clearly identified as the place to focus.
What You Can Expect
Plants that start looking at variation rather than averages usually notice two things.
The first is that the opportunity is larger than the average suggested. A line averaging 75% that swings down to 55% on its worst shifts has a great deal of recoverable performance sitting in those bad shifts - often more than could ever be squeezed from the good ones. The floor has more room than the ceiling.
The second is that stability improvements tend to stick. Raising the floor usually means finding and fixing a specific, repeatable cause - a handover practice, a product-specific setting, a shift-specific habit. Once addressed, the worst shifts stay up, and the whole line becomes more predictable. Unlike a one-time push on the good shifts, a stability gain compounds.
The shift from managing averages to managing variation is one of the most important a production team can make, and it is the natural pivot point of any serious continuous improvement effort.
Closing
Averages are comfortable because they are simple. But they are also where stability problems go to hide. The line that swings is costing you more than its average admits - in planning, in inventory, in the capacity you hold back just to absorb the bad days.
June was about the losses you could not see because they were too small. July is about the losses you cannot see because they are averaged away. Next month, in August, we turn to the most powerful lever for closing the gap between your best and worst shifts: operators and standard work — making what the best shift does repeatable across all of them.
