Over the summer we looked at line stability — why a line that runs steadily at 75% is usually in better shape than one that averages 75% by swinging between 55% and 92%, and why the gap between your best and worst shift is the real opportunity. If you missed it, the July article on line stability is the step this one builds on.
This month we take that same principle and apply it to the single operation where it costs the most: the changeover.
Changeovers are where variation is widest, where the difference between a good run and a bad one is most visible, and where the gap between your best performance and your typical performance is usually measured in hours rather than percentage points.
Why This Is the Next Step
Line stability taught us to look at the spread rather than the average. Changeovers are where that spread is most dramatic — and most recoverable.
The methodology for reducing changeover time is not a mystery. SMED — Single-Minute Exchange of Dies — was developed by Shigeo Shingo at Toyota between the 1950s and 1960s, and it is one of the best-documented techniques in lean manufacturing. The principle is straightforward: separate the setup steps that require the machine to be stopped (internal) from those that can be done while it is still running (external), then systematically convert internal work to external and streamline what remains. Shingo’s documented results averaged reductions of around 94% — changeovers going from ninety minutes to under five.
So the problem in most plants is not that the method is unknown. It is that the changeover itself is not measured precisely enough for anyone to know where the time actually goes, or how much the same changeover varies between one crew and another.That is the gap this article is about.

What Typically Goes Wrong
There are four recurring patterns in plants that have not yet got changeovers under control.
The changeover is recorded as a single block of time. The shift report says “changeover: 85 minutes.” That number is accurate and completely useless for improvement, because it contains no information about what happened inside those 85 minutes. Which steps took longest, which were waiting for materials, which were done twice — none of it is visible.
Nobody knows the variation. Ask most plants how long a given changeover takes and you will get an average. Ask how long the fastest one took and the slowest one, and you will usually get a shrug. But that range is the entire improvement opportunity. A changeover that has been done in 45 minutes and also in 110 minutes is telling you that 65 minutes of that time is not inherent to the task — it is variation.
The best practice exists but is not captured. In almost every plant, one crew does the changeover noticeably better than the others. They have worked out a sequence, they stage materials differently, they do something in parallel that others do sequentially. That knowledge is real and it is sitting on the floor — but because it has never been observed, documented, or measured, it stays with that crew and never spreads.
Changeovers are treated as fixed cost. If the changeover has always taken 85 minutes, it becomes a planning assumption rather than an improvement target. Schedules are built around it, batch sizes are inflated to avoid it, and the cost is absorbed permanently instead of being attacked.
What Good Looks Like
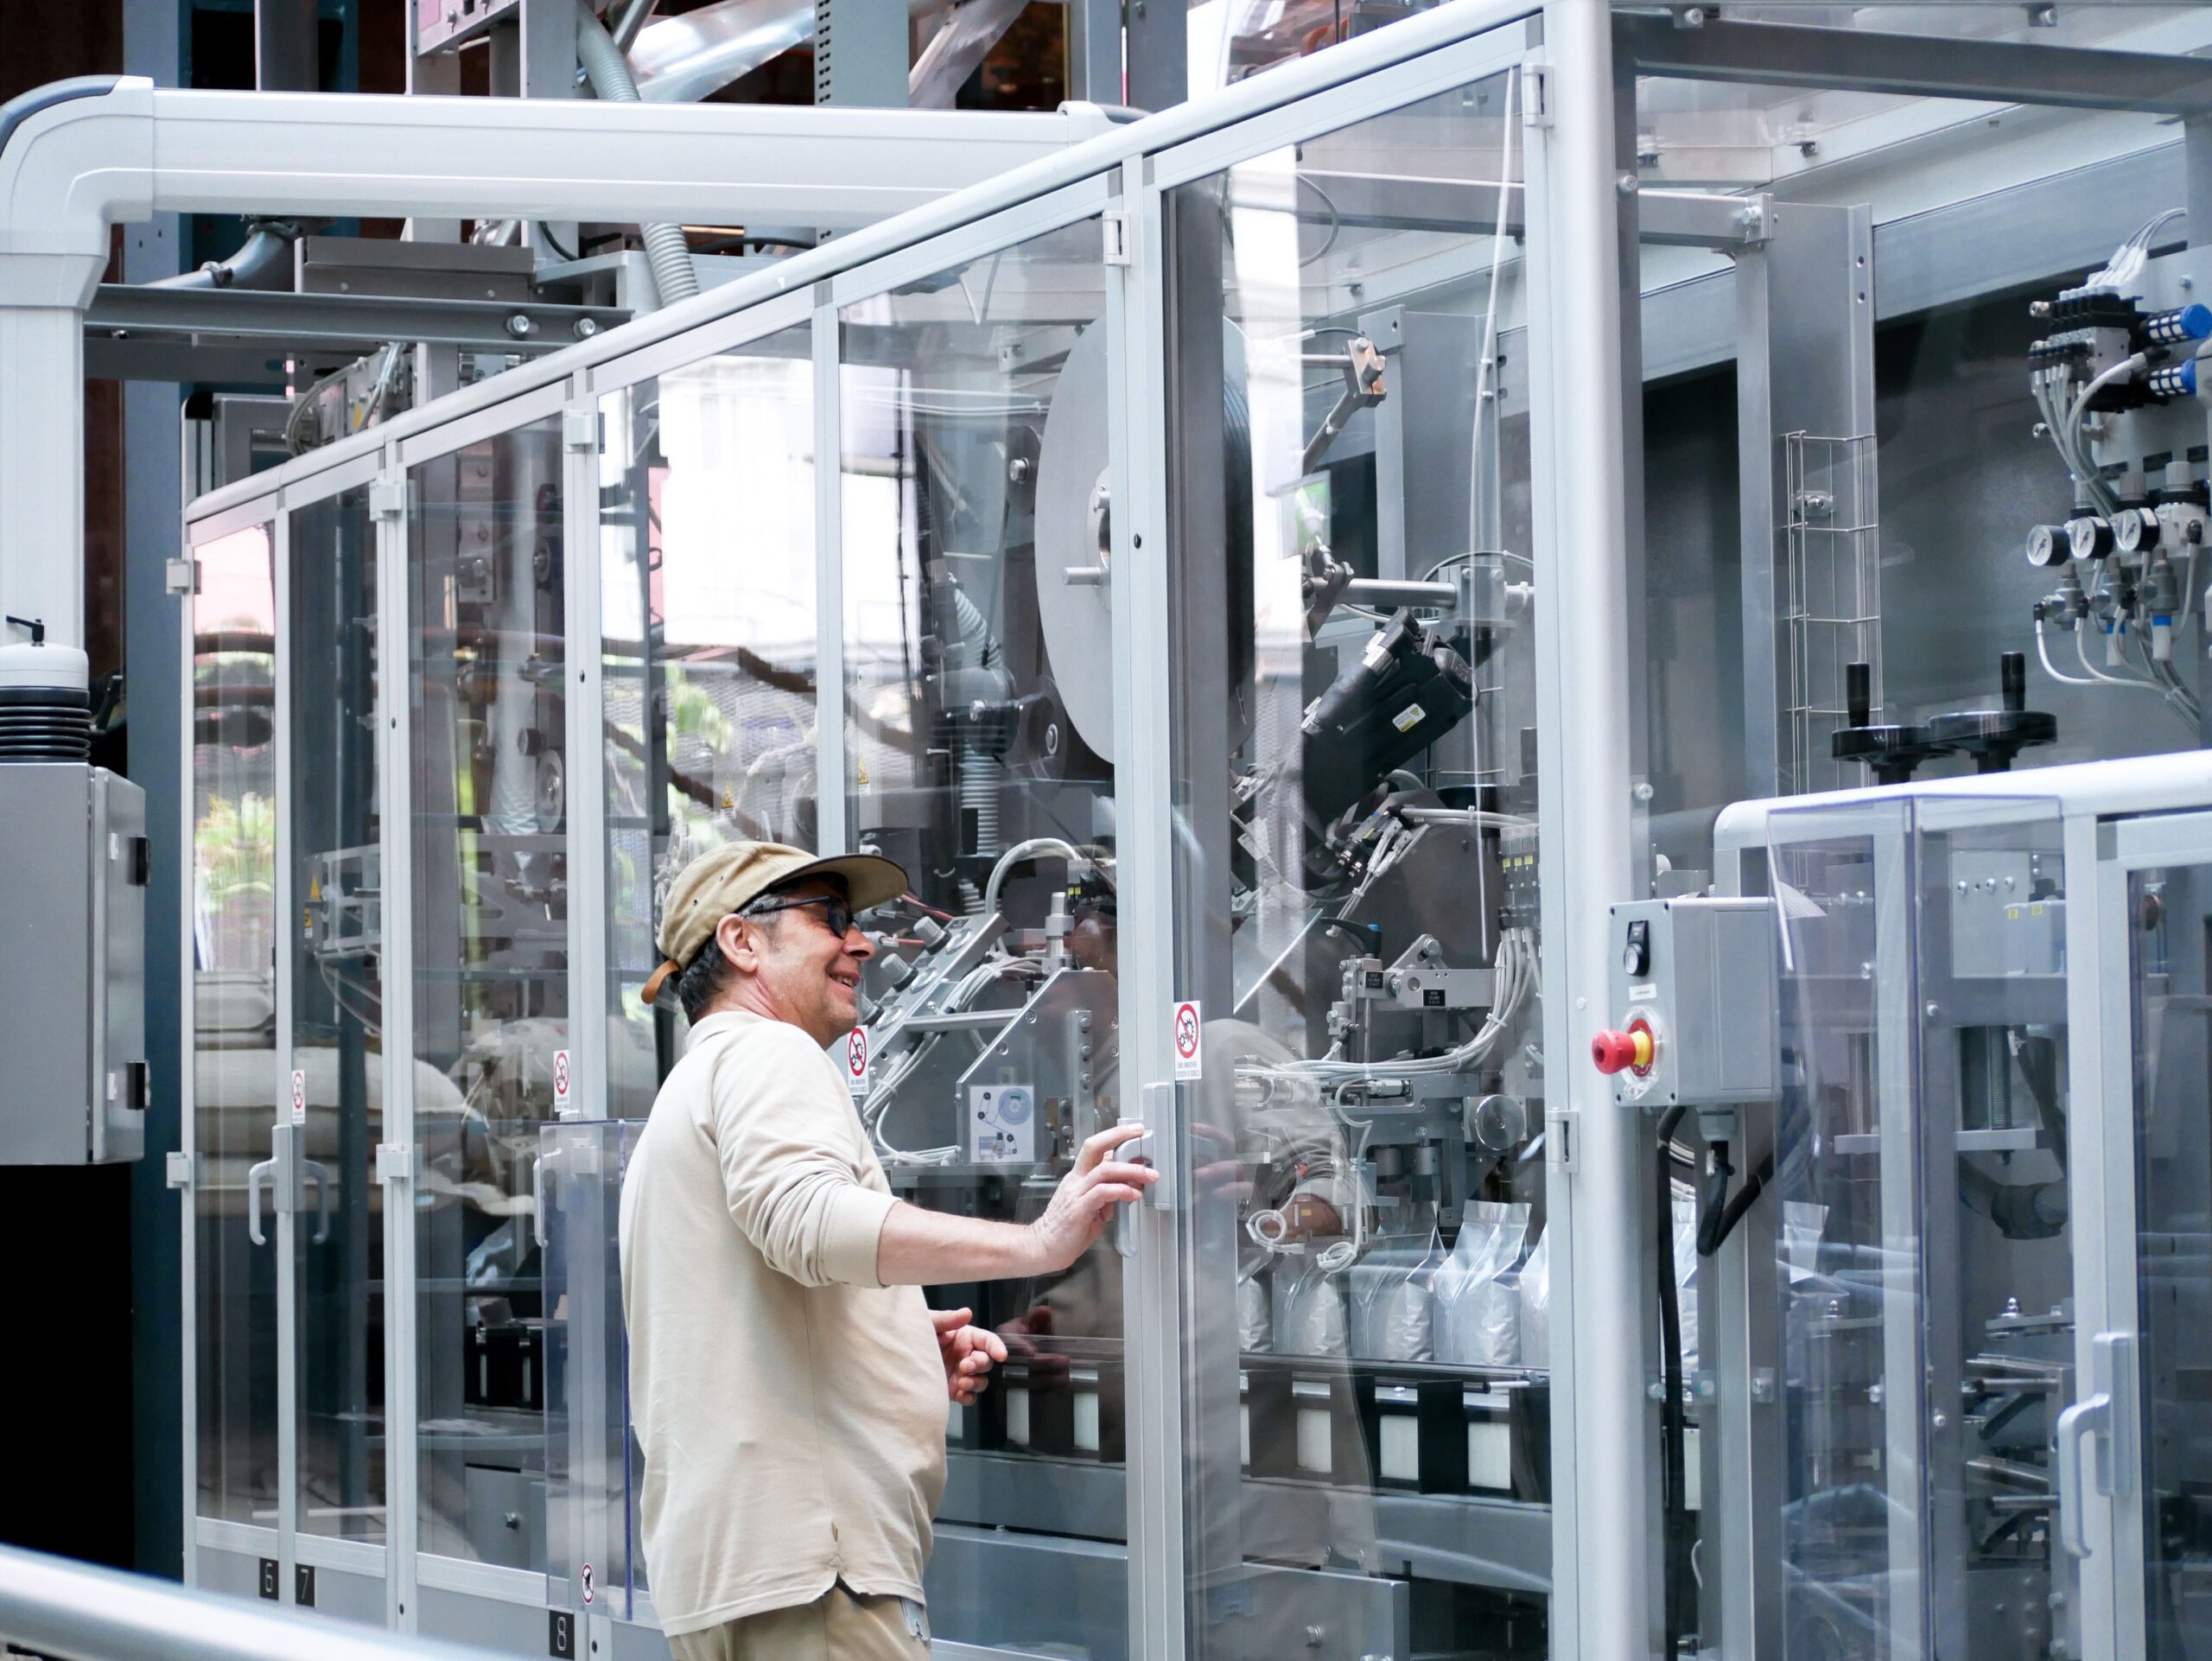
A plant with changeovers under control looks different in three specific ways.
The changeover is measured as a sequence, not a block. Each step is time-stamped, so the team can see where the time actually goes. This is what makes the SMED separation possible in practice — you cannot classify steps as internal or external until you can see the steps.
The full distribution is visible, not just the average. The team knows the fastest changeover ever recorded for a given product pair, the typical one, and the worst one. The fast one is not an anomaly to be explained away. It is proof of what the line can do, and it becomes the benchmark.
The best method is documented and repeatable. Once the fastest changeover is understood, the sequence that produced it becomes the standard — not a binder nobody reads, but the actual working method that every crew is trained on and measured against. This is the point where changeover optimization and standard work become the same activity.
From Data to Action
The practical sequence for improving changeovers follows naturally from the stability work in July.
First, establish whether changeovers are worth attacking. A common rule of thumb in lean practice is that if changeovers account for at least 20% of lost productive time, a structured SMED programme is justified. If they account for much less, your effort is better spent elsewhere — the Pareto discipline from May still applies.
Second, measure the variation before you try to reduce the average. Pull every instance of the same changeover over a representative period. Look at the spread. The gap between your fastest and your typical changeover is your immediate, no-investment opportunity — it requires no new equipment, only replication of something your own team has already achieved.
Third, break the changeover into its steps and apply the SMED separation. With step-level timing, classify each element as internal (machine must be stopped) or external (can be done while running). Move everything that can be moved. In most documented cases this separation and conversion alone delivers around half the total available reduction.
Fourth, standardise the best method and measure against it. Take the sequence from the fastest changeover, make it the documented standard, and track every subsequent changeover against that benchmark rather than against the old average. The goal is a narrower band — every crew approaching the best crew — before it is a lower average.

Where Indeex Fits
Changeover optimization depends entirely on having precise, step-level data about what actually happened — and that is exactly what manual recording cannot provide.
Indeex detects changeovers automatically from the line and records them as sequences rather than single blocks, with each phase time-stamped. The team can see where the time went inside the changeover, not just how long it lasted in total.
Because every instance is captured, the full distribution is available: the fastest changeover for a given product pair, the typical one, the slowest, and how that varies by shift, by crew, and by product combination. The best performance the line has ever achieved is visible as a fact rather than a memory — which turns it into a credible internal benchmark instead of an aspiration.
And because the measurement is continuous, the effect of any improvement is visible immediately. When a new standard method is introduced, the team can see whether the band is actually narrowing, rather than waiting for a monthly average to eventually move.

What You Can Expect

The variation is wider than anyone believed. The same changeover, same product pair, same equipment, routinely varies by a factor of two between the best and worst instance. This is uncomfortable to see for the first time, but it is also the good news — because the fastest instance is proof that the shorter time is achievable with the resources already in the building.
The first gains come from replication, not engineering. Before any SMED redesign, simply bringing the typical changeover closer to the best changeover already recovers a significant share of the loss. That gain requires no capital and no new tooling — only visibility into what the best crew does differently, and the discipline to make it the standard.
The engineering work of SMED then delivers the next, larger step. But the sequence matters: measure the variation, replicate the best, then redesign the method.
Closing
Changeovers are one of the few places in a plant where the proof of what is possible already exists in your own production history. Somebody has already done it faster. The question is only whether you can see it, and whether you can make it repeatable.
July showed us that the gap between the best and the typical is where the opportunity sits. September applies that directly to the operation where the gap is widest. Next month, in October, we step back from individual operations to the system as a whole: bottleneck management, and why optimizing the wrong machine produces no result at all.
Next Step
If your changeovers are recorded as a single block of time, you have the number but not the information — and the gap between your best changeover and your typical one is invisible.
We can show you what a real changeover looks like measured step by step, how wide the variation actually is on a working line, and how the fastest instance becomes a benchmark your team can be trained against.
References
Lean Production, SMED (Single-Minute Exchange of Die) — leanproduction.com
Single-minute exchange of die, Wikipedia — en.wikipedia.org
